Process to create a graph
I am a member of the town of Martorell and these are the pollution parameters that exist in Martorell and we will see them represented in graphs.
What you are going to see is ALL the process:
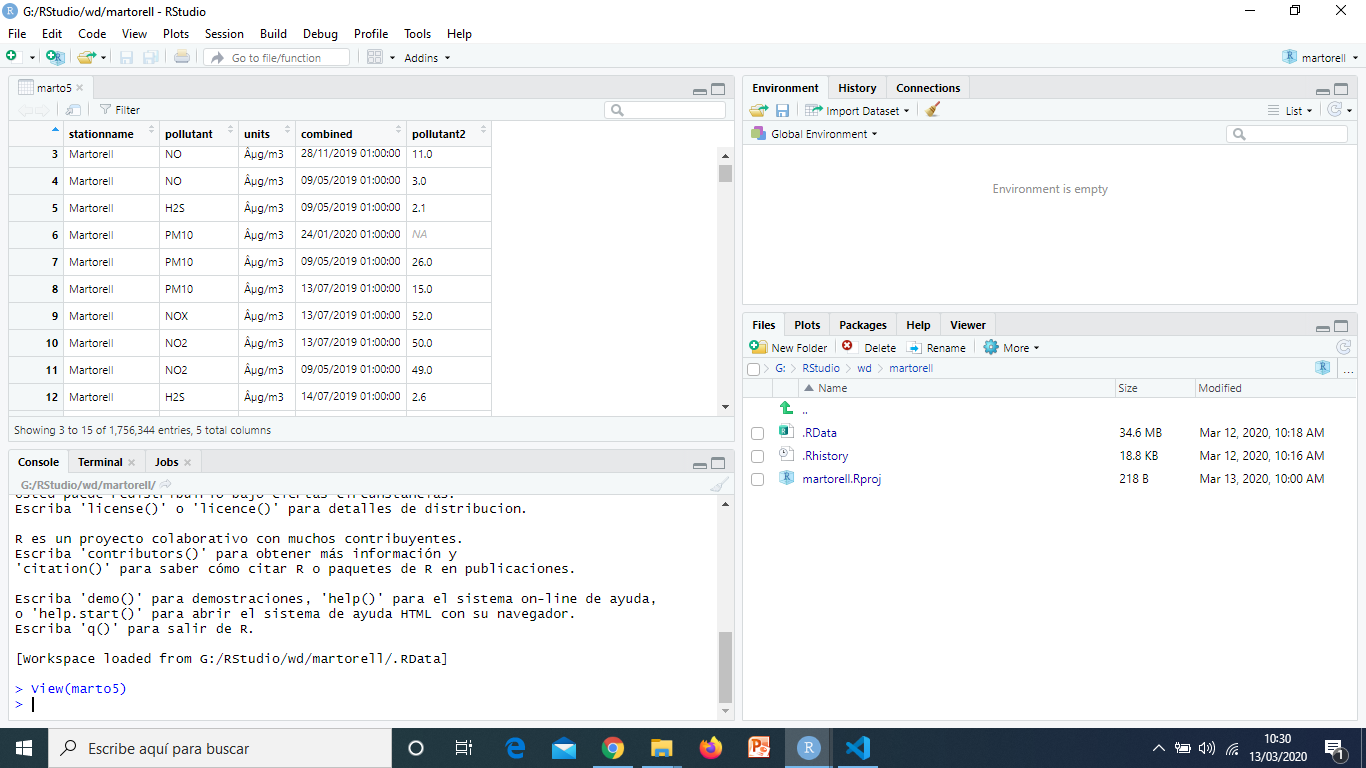
This is the initial situation
The first thing we are going to do is remove columns 1 and 3 since we don't need them
This is the result:

Now i need to have the data frame "combined" to the left of everything, i decided to use an Rbase instruction but it turns out i just changed the names :(
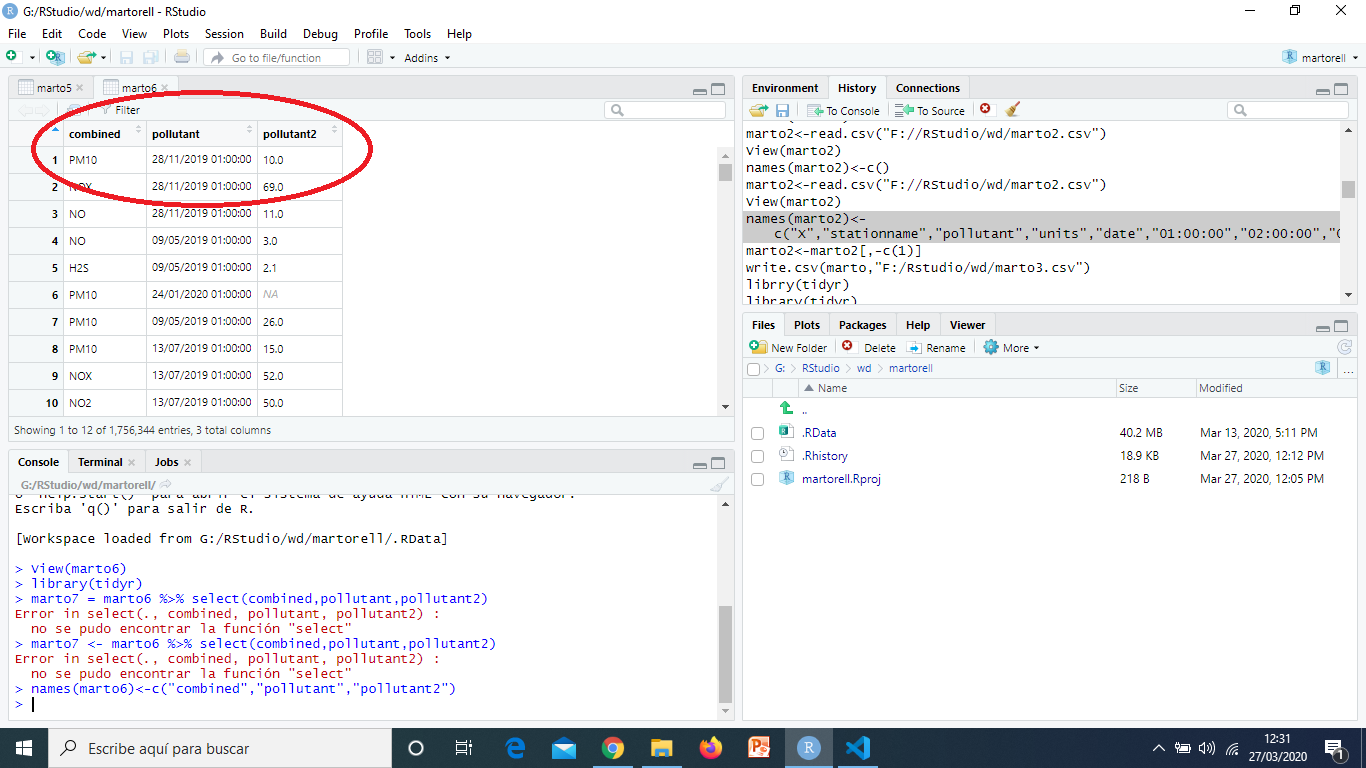
I had to put it as before and find an instruction that would help me to have the hours in front of everything so that later it does not have problems
I decided to use a dplyr library selecting all the dataframes but in different order and it worked

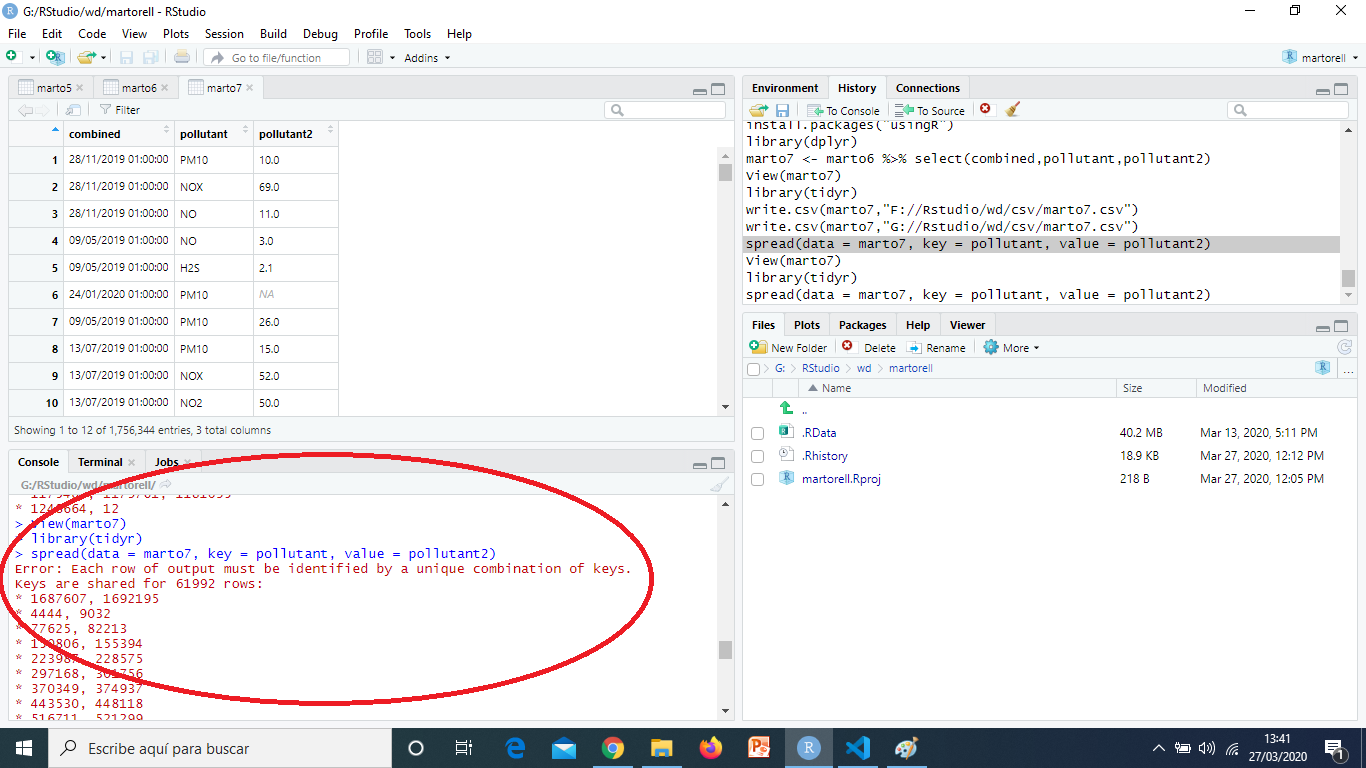
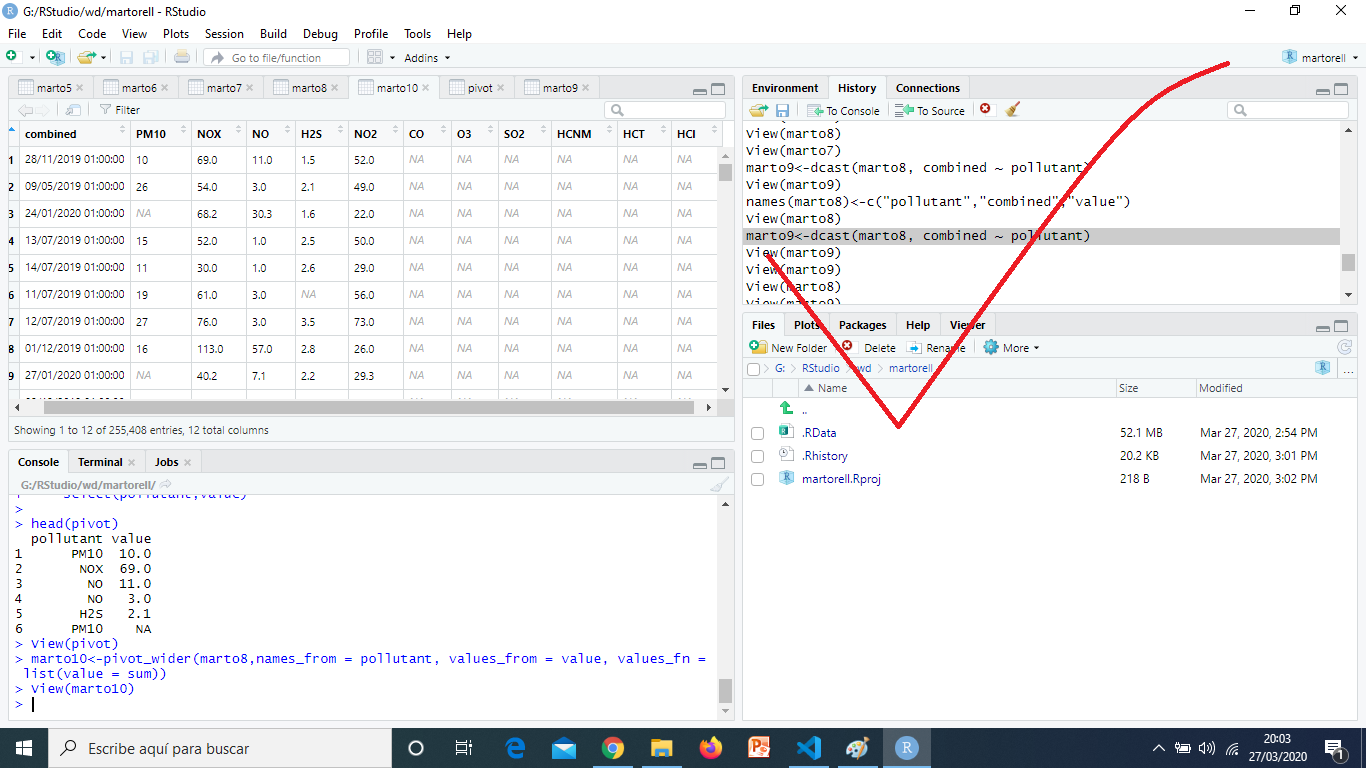
This is the error I get when making the spread that I have no idea to solve:
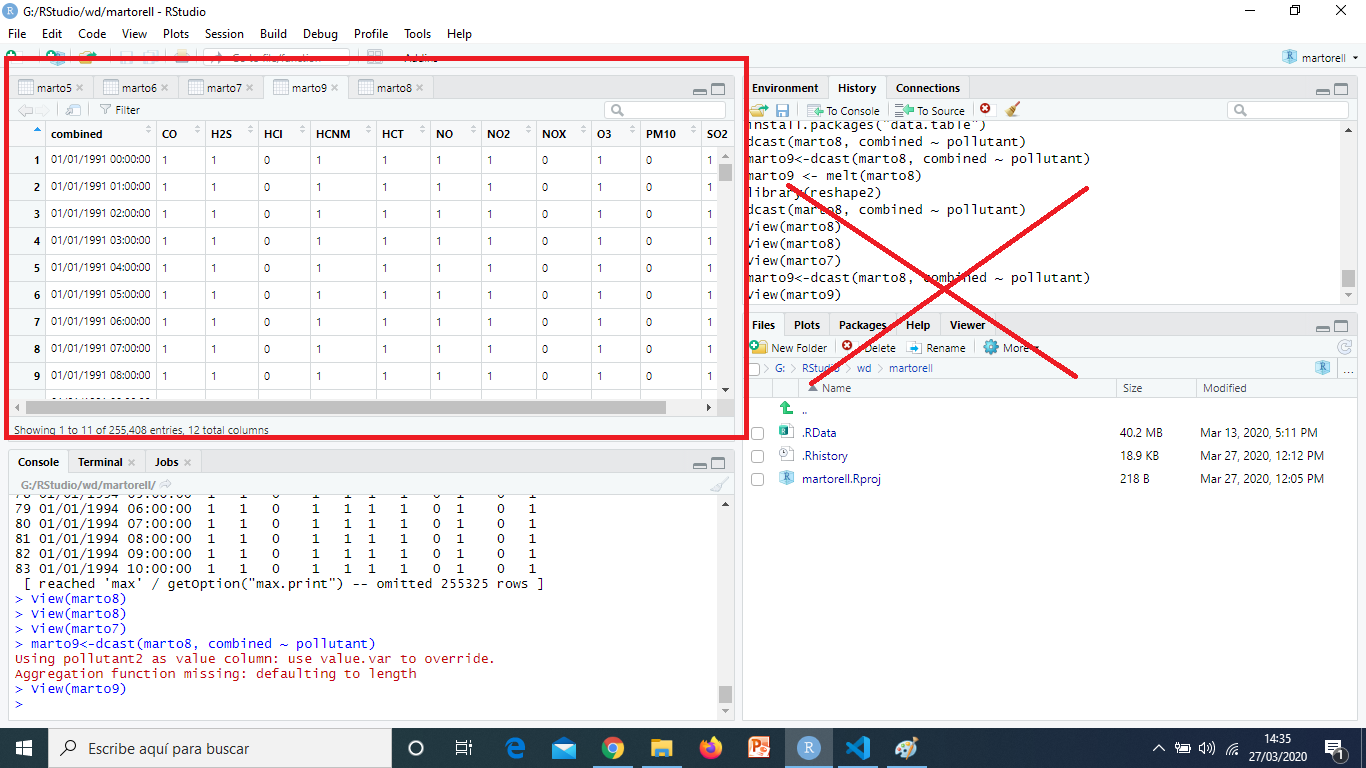
I tried to find another alternative to the spread and I found the library "reshape2", which applying a function called "rcast" managed to do what I wanted but the values it gave were only 1 or 0, this was the result: (also had also ordered the dates!)
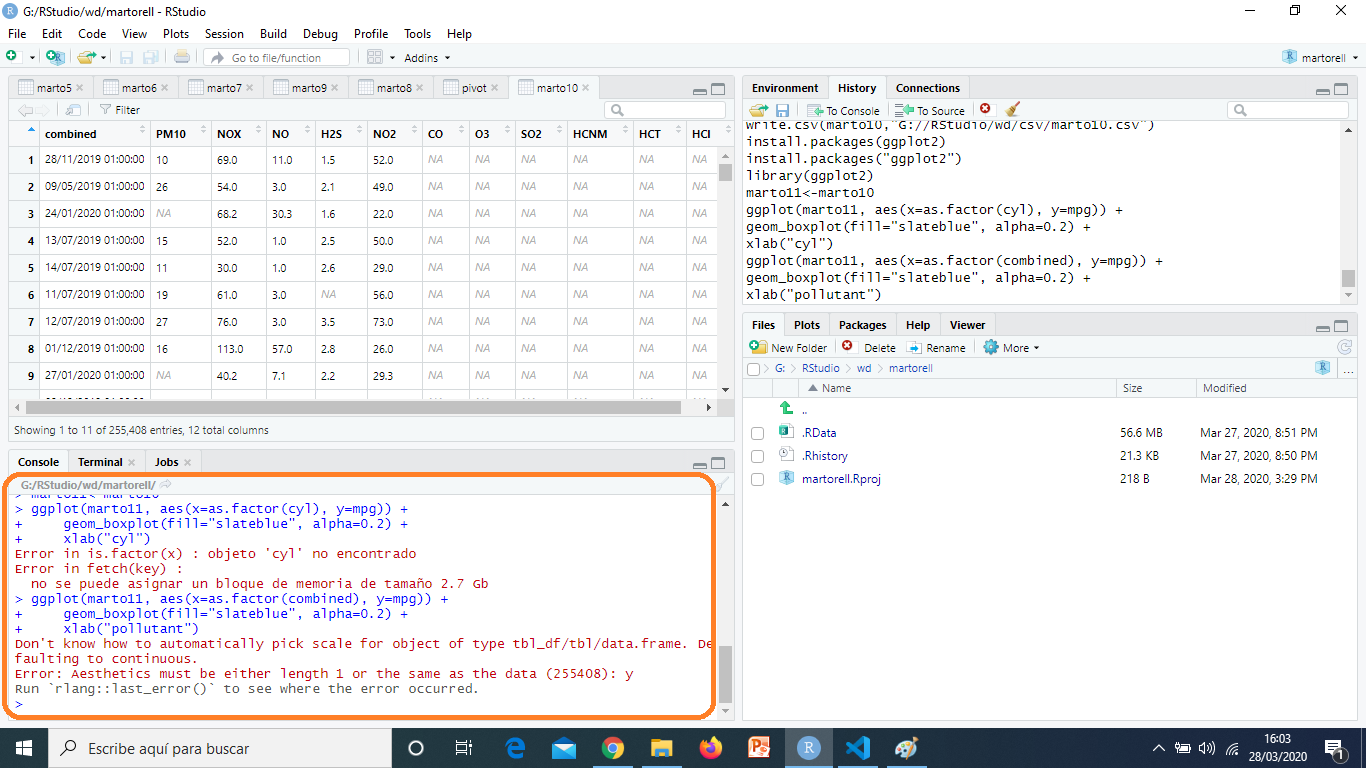
After a long, LONG TIME I got an instruction that allowed me to do what I wanted from the beginning and with all the real values!! Is this:
I downloaded a library called "ggplot2" but it didn't work for me so I kept looking
These were the errors he gave me:
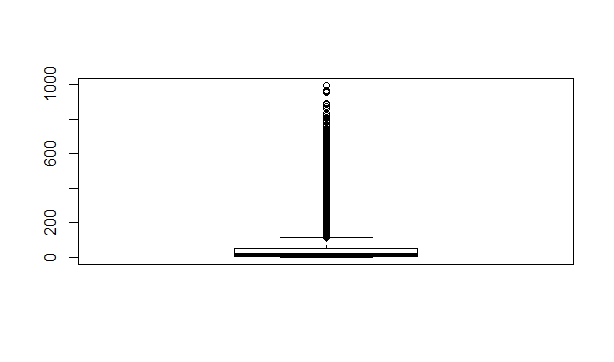
So what I did is look at the tecnologies.net page and I found a very simple code to make a boxplot putting "boxplot (marto10 $ NO)"
This bloxplot only marks NO:
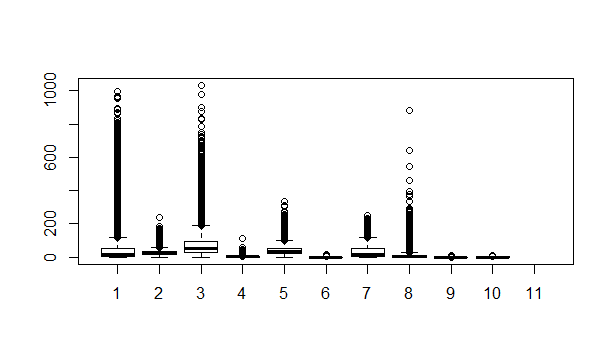
I tried to put all the pollutants in the boxplot but it was a mess and gave me errors everywhere
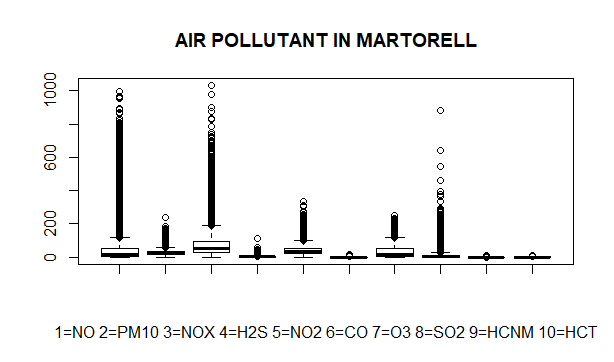
Then I discovered that I had to put (marto10 $ NO) and repeat the same process with all the contaminants
boxplot(marto10$NO,marto10$PM10,marto10$NOX,marto10$H2S,marto10$NO2,marto10$CO,marto10$O3,marto10$SO2,marto10$HCNM,marto10$HCT,marto10$HCl)
This is the resut:
So I learned how to put names below and the most important thing, to have a title:
This is a plot type graph:


You can also change the color of the graphics and the xlab and the ylab:


I have installed the openair, I have made it know how to identify the "Date" but still I get this error that I do not know and that I have been trying to solve for a long time but I cannot

I have obtained several graphs but on the way back if you could tell me what I have done wrong so that the openair does not come out I can fix it and make the graphs, thanks.
By: Guillem